
What six months of customer transaction data show about eSIM, physical SIM and purchased data allowances.
Sim Card Airport Bali analysed more than 3,500 classified SIM and eSIM units sold from April through September 2026 across 16 purchased data allowances. This report describes purchases in our customer dataset. It does not estimate the behaviour of all visitors to Bali.
Key findings
- About 89% of classified connectivity units were eSIMs; approximately 11% were physical SIMs.
- eSIM represented at least 85% in every observed month.
- 10GB was the leading single allowance, representing about 12%.
- 21–50GB was the largest allowance band, accounting for approximately 31%.
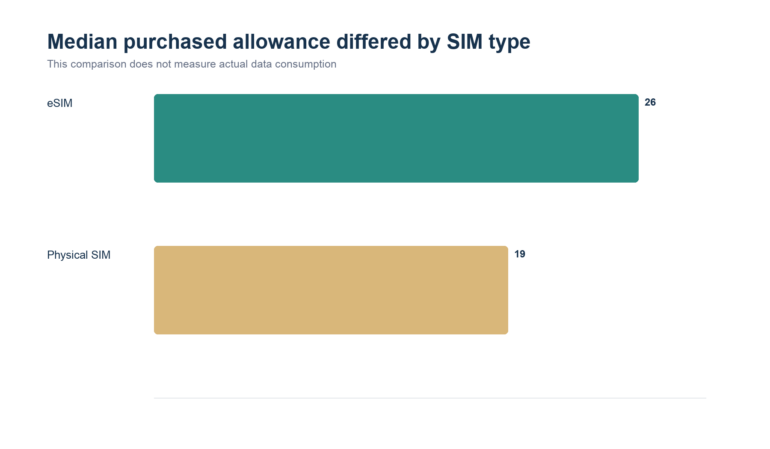
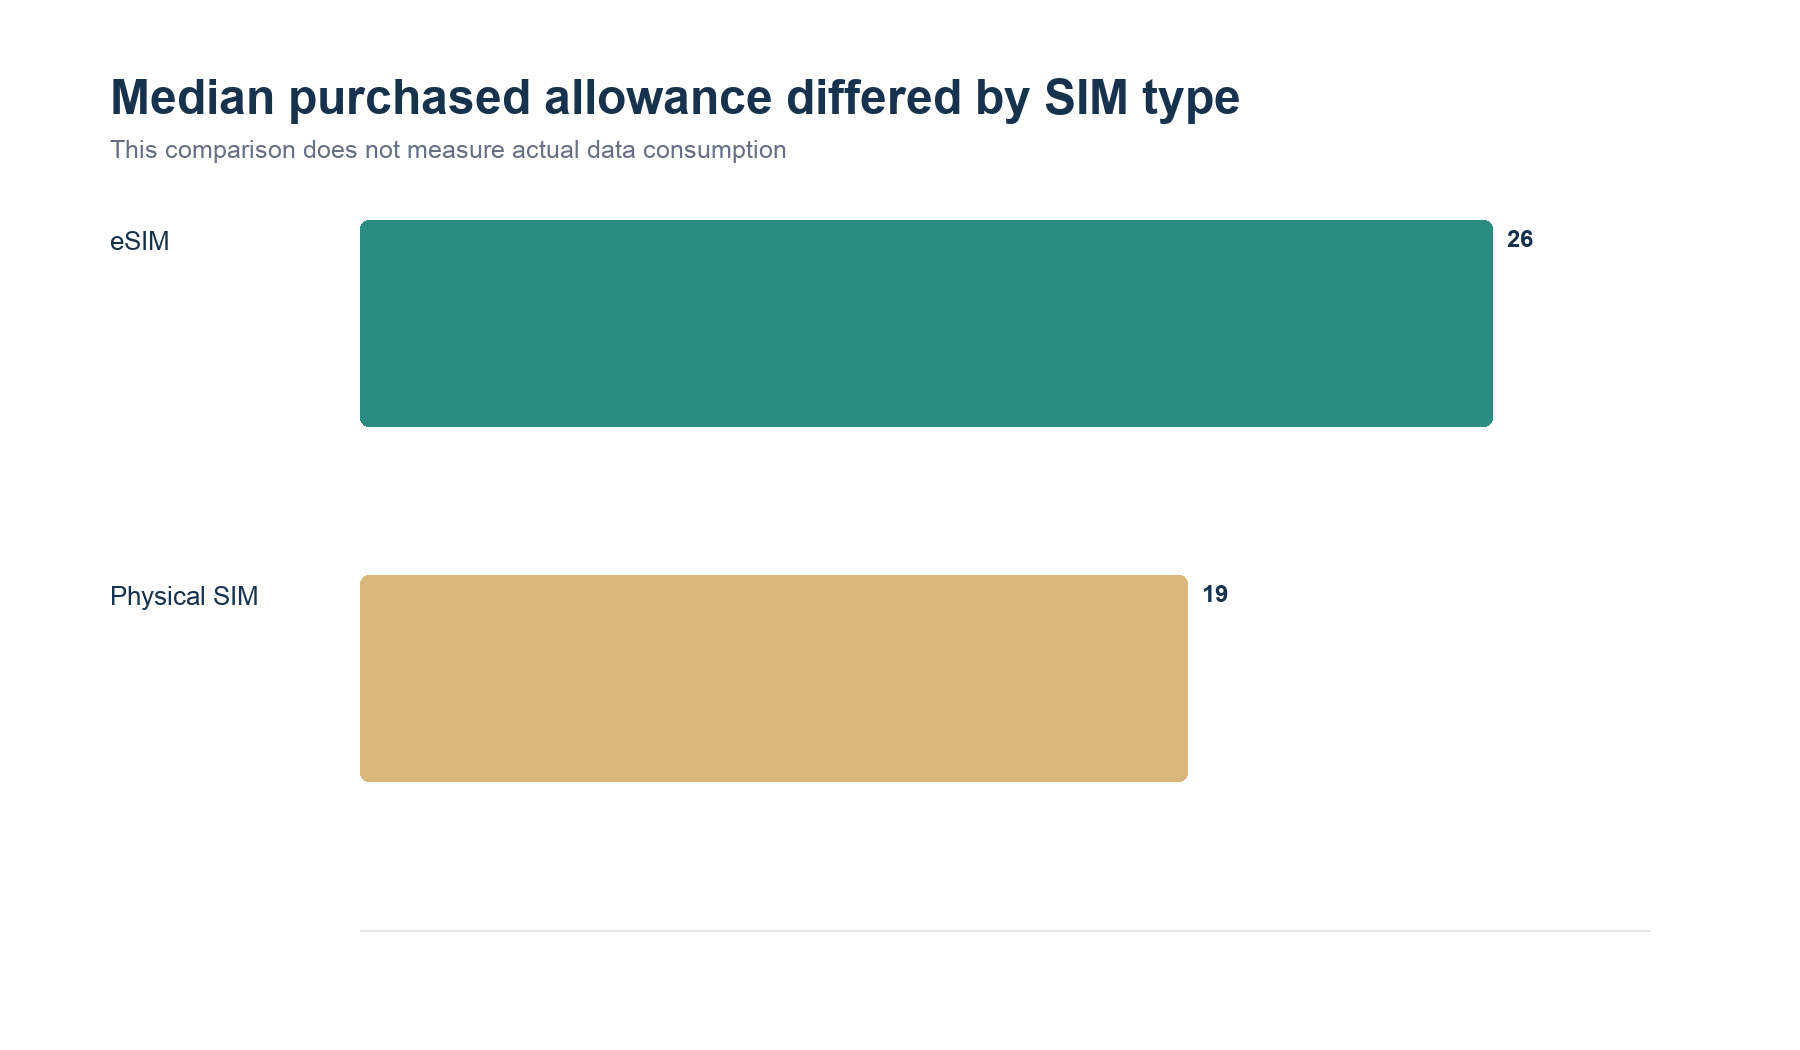
- The median purchased allowance was 26GB for eSIM and 19GB for physical SIM.
- Indexed item volume was highest in August. Six months is too short to establish seasonality.
About 89% of classified connectivity units were eSIMs
Across more than 3,500 classified connectivity units, approximately 89% were eSIMs and 11% were physical SIMs.
| SIM type | Share |
|---|---|
| eSIM | About 89% |
| Physical SIM | About 11% |
This is the sales mix within Sim Card Airport Bali’s dataset. It is not an eSIM adoption rate for Bali tourists as a whole.
eSIM remained the majority choice in every observed month
The monthly eSIM share ranged from approximately 85% to 90%. It remained above 85% in every observed month.
| Month | Approximate eSIM share |
|---|---|
| April | 85% |
| May | 90% |
| June | 89% |
| July | 89% |
| August | 90% |
| September | 88% |
10GB was the leading single allowance
The dataset contains 16 purchased allowances, from 3GB to 171GB. No single allowance accounted for more than 12% of classified connectivity units.
| Rank | Purchased allowance | Approximate share |
|---|---|---|
| 1 | 10GB | 12% |
| 2 | 29GB | 11% |
| 3 | 59GB | 10% |
| 4 | 171GB | 9% |
| 5 | 21GB | 9% |
21–50GB was the largest allowance band
The 16 allowances were grouped into five bands to compare the distribution of purchased package sizes.
| Purchased allowance band | Approximate share |
|---|---|
| Up to 10GB | 21% |
| 11–20GB | 16% |
| 21–50GB | 31% |
| 51–100GB | 20% |
| More than 100GB | 12% |
These figures measure allowance purchased. The workbooks do not contain actual data consumption, unused balance or top-up activity.
Median purchased allowance differed by SIM type
The median purchased allowance was 26GB for eSIM and 19GB for physical SIM. That seven-gigabyte difference describes the packages sold in this dataset. It does not show that eSIM users consumed more data, stayed longer or had different travel needs.
Most purchases were single-item orders
Approximately 95% of orders contained one sold item. About 5% contained two items, while orders containing three or four items each represented less than 1%.
A one-item order does not prove that the buyer travelled alone. The dataset records products, not party composition.
Indexed item volume was highest in August
Using April as an index baseline of 100, recorded item volume reached 147 in August before easing to 135 in September.
| Month | Item-volume index (April = 100) |
|---|---|
| April | 100 |
| May | 123 |
| June | 131 |
| July | 122 |
| August | 147 |
| September | 135 |
The report does not attribute the August high point to visitor arrivals, school holidays or another cause. Six months of one company’s sales data cannot establish tourism seasonality.
Methodology
Data source and observation period
This analysis is based on six monthly Sim Card Airport Bali order workbooks covering April through September 2026.
Analytical scope
Order-level records were used for order-size and monthly-trend findings. Item-level product records were used for findings about SIM type and purchased data allowance. Connectivity analysis covers more than 3,500 classified SIM and eSIM units; non-connectivity products are outside that scope.
Product classification
Connectivity units were classified by SIM type and purchased data allowance using the product information recorded in the workbooks. Allowance figures refer to package size purchased, not data consumed.
Public reporting
Counts and commercial totals are not published. Sample size is stated as a minimum threshold, shares are rounded, and monthly movement is reported as an index with April set to 100.
Denominators
- SIM type and allowance findings use classified connectivity units recorded during the observation period.
- Monthly eSIM shares use classified connectivity units within each month.
- Rounded percentages may not sum exactly to 100%.
Limitations
This is a census of the supplied Sim Card Airport Bali order records for the six-month period, not a probability sample of Bali visitors. The findings should not be generalised to every tourist, seller or connectivity purchase in Bali.
The workbooks do not contain nationality, trip duration, arrival or pickup time, device model, activation outcome, support issue, actual data consumption, unused balance or a verified customer-level conversion funnel. Monthly movement is descriptive and should not be labelled seasonality without a longer time series.
Public context
BPS Bali recorded 6,948,754 direct foreign visitor arrivals in 2025, up 9.72% from 2024. That figure describes the tourism market, not the sampling frame for this report. Global eSIM research provides context, but global adoption figures cannot be projected onto Bali or our customer base.
About the data
This report was produced by Sim Card Airport Bali from its own order records. Aggregated findings may be cited with attribution and a link to this page. Customer-level data and exact commercial totals are not published.
Source: Sim Card Airport Bali, Bali Tourist Connectivity Trends at Sim Card Airport Bali 2026, analysis of more than 3,500 classified connectivity units recorded April–September 2026.
About Sim Card Airport Bali
Sim Card Airport Bali provides physical SIM and eSIM connectivity products for visitors to Bali. This page is a research publication based on the company’s transaction records. For practical buying guidance, read our guide to buying a SIM card in Bali.


